-
R연습❤️] R - plot()함수를 이용한 삼각함수 시각화코딩Coding/R_연습 2022. 6. 22. 20:07728x90
R - plot( )함수를 이용한 삼각함수 시각화
r_hello.R
x <- seq(-10, 10, 0.1)
plot(x, sin(x), type = "l", col = "orange", main = "Sine Function")
grid()
터미널 창에서Rscript r_hello.R 실행하면 r_hello.pdf 만들어짐. 그거 실행한거 결과 보면 됨. 실행됨.
or
VSCode 에서 Shift + command + Enter 누르면 실행 됨
결과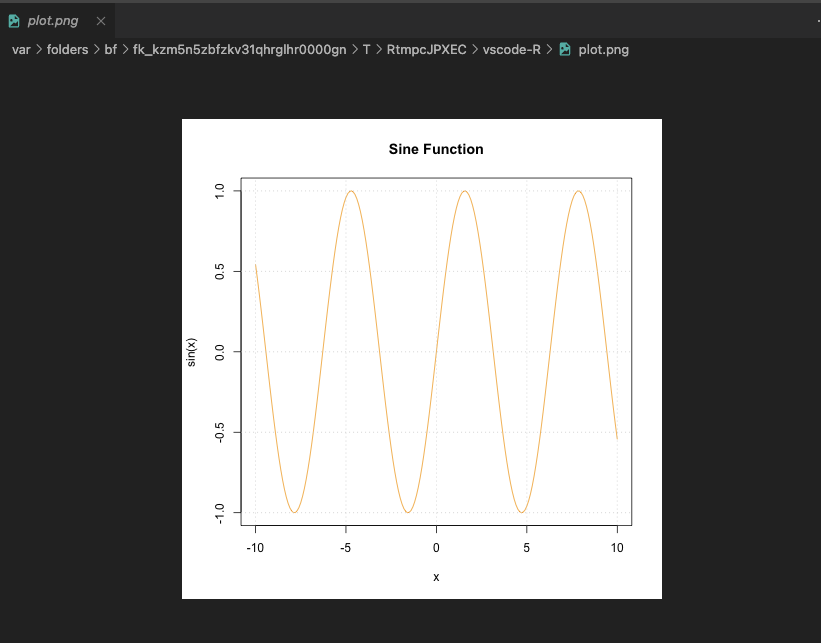
출처 :
https://m.blog.naver.com/padosori60/220861591002R - plot( )함수를 이용한 삼각함수 시각화
> x <- seq(-10, 10, 0.1) > plot(x, sin(x), type = "l", col = "orange", main = "Sine Funct...
blog.naver.com
seq() 함수의 의미
https://m.blog.naver.com/jungj5011/220612995076seq()함수와 rep()함수
벡터를 형성하는데 유용한 두 개의 함수를 살펴보자. seq()함수는 등차수열을 나타내는데 사용되는 함수다....
blog.naver.com
https://stackoverflow.com/questions/4369400/plot-the-shaded-region-under-y-sinx-in-rplot the *shaded* region under *y=sin(x)* in R
I would like to plot the shaded region between y=sin(x) and y=0 over x in [0, pi] in R. Can you give some examples? By shaded, I mean the region can be colored and better be half-transparent. Tha...
stackoverflow.com
한글러스트Rust강의_027_Rust vs R 기초part1_sin cos 그래프 그리기 #sin #cos #rustlang #maths #graph
https://youtu.be/GMD-6NU7zUA
반응형'코딩Coding > R_연습' 카테고리의 다른 글
R❤️) R language hello world 출력하기 (0) 2022.06.22 R연습_화씨 온도 변경 연습 (0) 2020.09.05